

- GBP/USD trades above 1.2850 after posting gains for two consecutive days.
- The technical outlook points to a bullish tilt in the near term.
- Annual CPI inflation in the US is forecast to soften to 2.6% in March.
GBP/USD continues to push higher and trades at around 1.2880 in the European session on Thursday after posting gains for two consecutive days. The pair’s technical outlook points to a bullish tilt as market focus shifts to March Consumer Price Index (CPI) data from the US.
British Pound PRICE This week
The table below shows the percentage change of British Pound (GBP) against listed major currencies this week. British Pound was the strongest against the US Dollar.
| USD | EUR | GBP | JPY | CAD | AUD | NZD | CHF | |
|---|---|---|---|---|---|---|---|---|
| USD | -0.78% | -0.05% | 0.37% | -1.32% | -1.87% | -1.70% | -1.33% | |
| EUR | 0.78% | 1.04% | 1.81% | 0.08% | -1.16% | -0.30% | 0.07% | |
| GBP | 0.05% | -1.04% | -0.53% | -0.95% | -2.18% | -1.33% | -0.96% | |
| JPY | -0.37% | -1.81% | 0.53% | -1.65% | -1.29% | -0.85% | -1.35% | |
| CAD | 1.32% | -0.08% | 0.95% | 1.65% | -0.89% | -0.39% | -0.28% | |
| AUD | 1.87% | 1.16% | 2.18% | 1.29% | 0.89% | 0.87% | 1.24% | |
| NZD | 1.70% | 0.30% | 1.33% | 0.85% | 0.39% | -0.87% | 0.37% | |
| CHF | 1.33% | -0.07% | 0.96% | 1.35% | 0.28% | -1.24% | -0.37% |
The heat map shows percentage changes of major currencies against each other. The base currency is picked from the left column, while the quote currency is picked from the top row. For example, if you pick the British Pound from the left column and move along the horizontal line to the US Dollar, the percentage change displayed in the box will represent GBP (base)/USD (quote).
The broad-based selling pressure surrounding the US Dollar (USD), following China’s decision to retaliate against the US tariffs by ramping up their own tariffs on US goods to 84% from the previously announced 34%, helped GBP/USD push higher in the first half of the day on Wednesday.
During the American trading hours, US President Donald Trump announced that he authorized a 90-day pause on reciprocal and 10% tariffs, effective immediately, but lifted the tariff rate on Chinese imports to 125%. The USD staged a rebound on this development and capped GBP/USD’s upside.
Despite Trump’s decision to pause reciprocal tariffs, investors remain concerned over the US economic outlook as the US’ trade conflict with China looks poised to deepen. In turn, the USD stays under renewed bearish pressure and allows GBP/USD to regain its traction.
Annual inflation in the US, as measured by the change in the CPI, is expected to soften to 2.6% from 2.8% in February. On a monthly basis, the CPI and the core CPI are forecast to rise by 0.1% and 0.3%, respectively. In case the monthly core CPI reading comes in above the market consensus, the USD could stay resilient against its rivals and make it difficult for GBP/USD to extend its uptrend. On the flip side, a soft core CPI print could weigh on the USD with the immediate reaction.
GBP/USD Technical Analysis
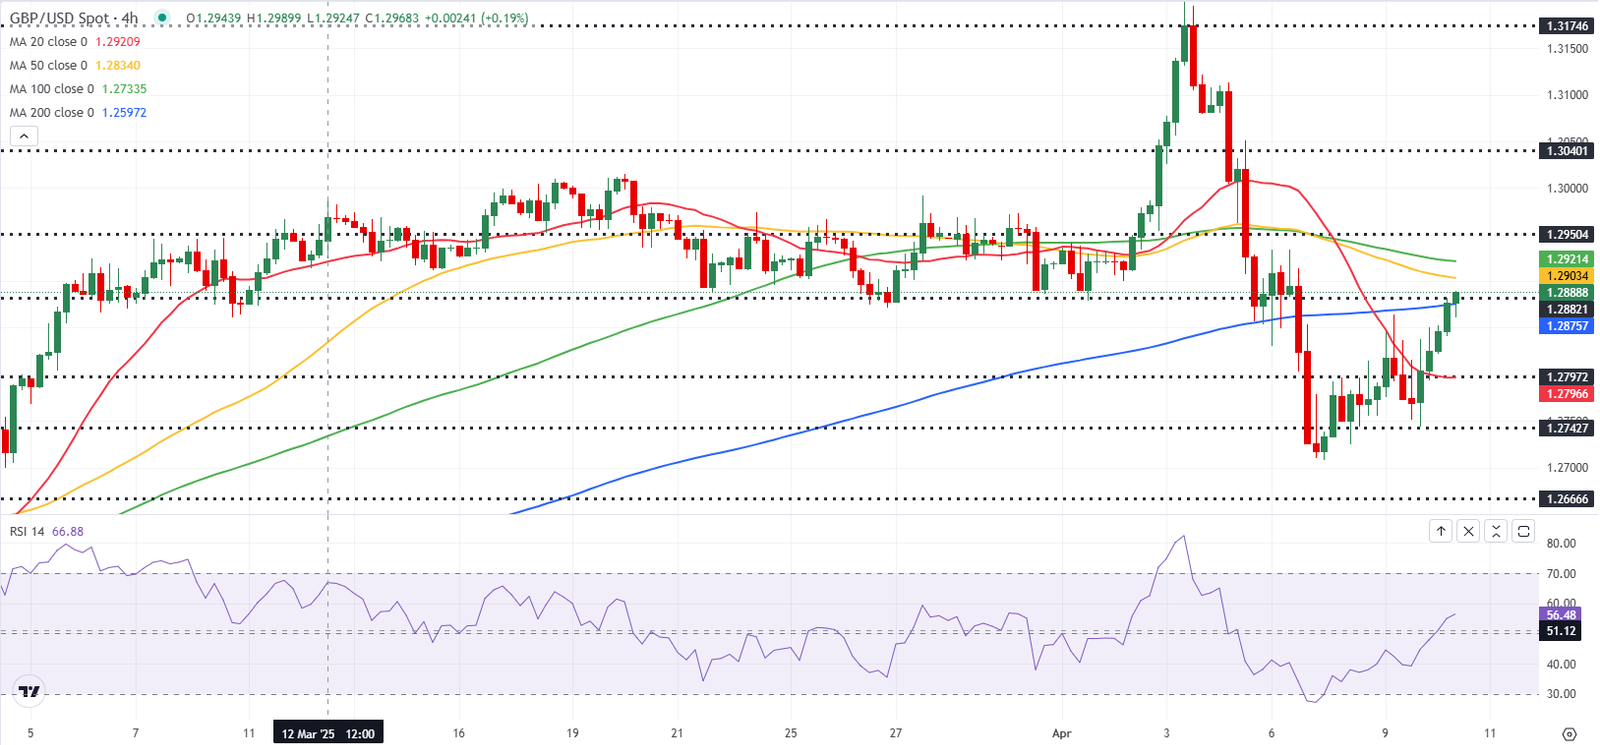
The Relative Strength Index (RSI) indicator on the 4-hour chart rises toward 60, reflecting a bullish tilt in the short term. Additionally, GBP/USD closed above the 200-day Simple Moving Average on Wednesday, reaffirming a lack of seller interest.
On the upside, 1.2880 (static level) aligns as interim resistance before 1.2925 (20-day SMA) and 1.3000 (psychological level, static level). Looking south, supports could be spotted at 1.2820 (200-day SMA), 1.2760 (50-day SMA) and 1.2700 (static level, round level).
US-China Trade War FAQs
Generally speaking, a trade war is an economic conflict between two or more countries due to extreme protectionism on one end. It implies the creation of trade barriers, such as tariffs, which result in counter-barriers, escalating import costs, and hence the cost of living.
An economic conflict between the United States (US) and China began early in 2018, when President Donald Trump set trade barriers on China, claiming unfair commercial practices and intellectual property theft from the Asian giant. China took retaliatory action, imposing tariffs on multiple US goods, such as automobiles and soybeans. Tensions escalated until the two countries signed the US-China Phase One trade deal in January 2020. The agreement required structural reforms and other changes to China’s economic and trade regime and pretended to restore stability and trust between the two nations. However, the Coronavirus pandemic took the focus out of the conflict. Yet, it is worth mentioning that President Joe Biden, who took office after Trump, kept tariffs in place and even added some additional levies.
The return of Donald Trump to the White House as the 47th US President has sparked a fresh wave of tensions between the two countries. During the 2024 election campaign, Trump pledged to impose 60% tariffs on China once he returned to office, which he did on January 20, 2025. With Trump back, the US-China trade war is meant to resume where it was left, with tit-for-tat policies affecting the global economic landscape amid disruptions in global supply chains, resulting in a reduction in spending, particularly investment, and directly feeding into the Consumer Price Index inflation.


