

- GBP/USD retreats after setting a new multi-year high on Thursday.
- Markets await the May employment report from the US.
- The technical outlook highlights buyers’ hesitancy in the near term.
GBP/USD edges lower on Friday and trades below 1.3550 after touching its highest level since February 2022 above 1.3600. The May employment report from the US could influence the US Dollar’s (USD) valuation and drive the pair’s action heading into the weekend.
British Pound PRICE This week
The table below shows the percentage change of British Pound (GBP) against listed major currencies this week. British Pound was the strongest against the Japanese Yen.
| USD | EUR | GBP | JPY | CAD | AUD | NZD | CHF | |
|---|---|---|---|---|---|---|---|---|
| USD | -0.58% | -0.53% | 0.19% | -0.43% | -0.84% | -1.07% | -0.17% | |
| EUR | 0.58% | 0.05% | 0.77% | 0.14% | -0.26% | -0.53% | 0.40% | |
| GBP | 0.53% | -0.05% | 0.76% | 0.10% | -0.31% | -0.58% | 0.35% | |
| JPY | -0.19% | -0.77% | -0.76% | -0.62% | -1.02% | -1.28% | -0.44% | |
| CAD | 0.43% | -0.14% | -0.10% | 0.62% | -0.41% | -0.67% | 0.26% | |
| AUD | 0.84% | 0.26% | 0.31% | 1.02% | 0.41% | -0.20% | 0.75% | |
| NZD | 1.07% | 0.53% | 0.58% | 1.28% | 0.67% | 0.20% | 0.94% | |
| CHF | 0.17% | -0.40% | -0.35% | 0.44% | -0.26% | -0.75% | -0.94% |
The heat map shows percentage changes of major currencies against each other. The base currency is picked from the left column, while the quote currency is picked from the top row. For example, if you pick the British Pound from the left column and move along the horizontal line to the US Dollar, the percentage change displayed in the box will represent GBP (base)/USD (quote).
GBP/USD gathered bullish momentum in the early American session on Thursday after the data published by the US Department of Labor showed that weekly Initial Jobless Claims rose to 247,000 in the week ending May 31 from 239,000 in the previous week.
In the second half of the day, renewed optimism about the US and China coming to terms on trade helped the USD hold its ground and capped GBP/USD’s upside. US President Donald Trump said that he held a phone call with Chinese President Xi Jinping to discuss trade and noted that their respective teams will soon meet for the next round of talks.
Nonfarm Payrolls (NFP) in the US are expected to increase by 130,000 in May, at a softer pace than the 177,000 reported in April.
In case there is a significant negative surprise in the NFP data, with a reading below 100,000, the USD could come under bearish pressure and allow GBP/USD turn north, once again. On the flip side, the USD could gather strength against its rivals and weigh on the pair if the NFP data comes in above 170,000 and shows that labor market conditions are still relatively healthy. In this scenario, markets could reassess the odds of a Federal Reserve rate cut in July. According to the CME FedWatch Tool, investors are currently pricing in about a 67% probability of the policy rate remaining unchanged after the July meeting.
GBP/USD Technical Analysis
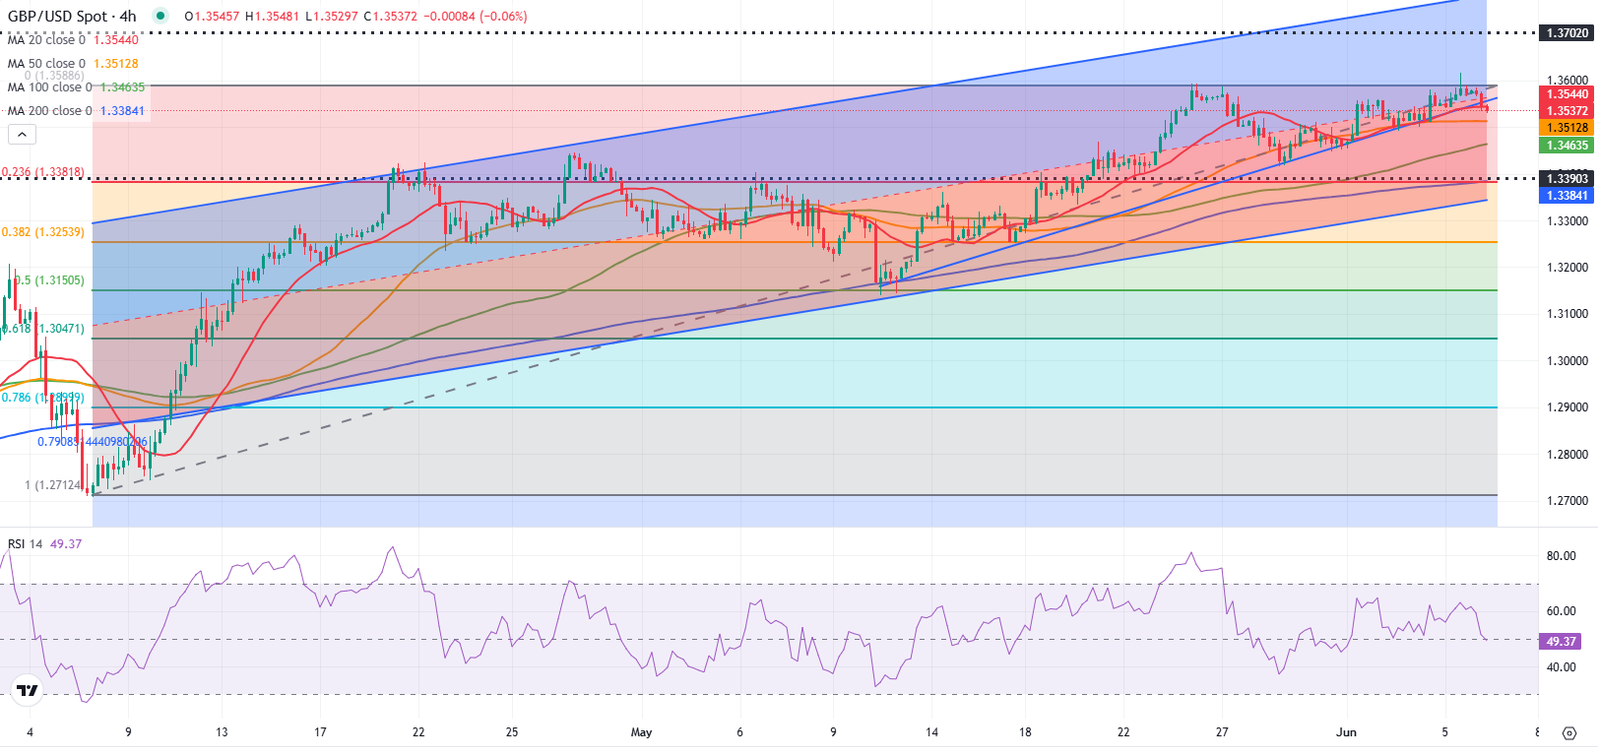
The Relative Strength Index (RSI) indicator on the 4-hour chart stays slightly below 50 and GBP/USD trades near the 20-period Simple Moving Average (SMA), suggesting that buyers move to the sidelines.
Resistances could be seen at 1.3590-1.3600 (static level, round level), 1.3700 (round level, static level) and 1.3770 (upper limit of the ascending regression channel).
Looking south, support levels align at 1.3500 (50-period Simple Moving Average(SMA), static level), 1.3450 (100-period SMA) and 1.3380 (Fibonacci 23.6% retracement level of the latest uptrend).
Pound Sterling FAQs
The Pound Sterling (GBP) is the oldest currency in the world (886 AD) and the official currency of the United Kingdom. It is the fourth most traded unit for foreign exchange (FX) in the world, accounting for 12% of all transactions, averaging $630 billion a day, according to 2022 data.
Its key trading pairs are GBP/USD, also known as ‘Cable’, which accounts for 11% of FX, GBP/JPY, or the ‘Dragon’ as it is known by traders (3%), and EUR/GBP (2%). The Pound Sterling is issued by the Bank of England (BoE).
The single most important factor influencing the value of the Pound Sterling is monetary policy decided by the Bank of England. The BoE bases its decisions on whether it has achieved its primary goal of “price stability” – a steady inflation rate of around 2%. Its primary tool for achieving this is the adjustment of interest rates.
When inflation is too high, the BoE will try to rein it in by raising interest rates, making it more expensive for people and businesses to access credit. This is generally positive for GBP, as higher interest rates make the UK a more attractive place for global investors to park their money.
When inflation falls too low it is a sign economic growth is slowing. In this scenario, the BoE will consider lowering interest rates to cheapen credit so businesses will borrow more to invest in growth-generating projects.
Data releases gauge the health of the economy and can impact the value of the Pound Sterling. Indicators such as GDP, Manufacturing and Services PMIs, and employment can all influence the direction of the GBP.
A strong economy is good for Sterling. Not only does it attract more foreign investment but it may encourage the BoE to put up interest rates, which will directly strengthen GBP. Otherwise, if economic data is weak, the Pound Sterling is likely to fall.
Another significant data release for the Pound Sterling is the Trade Balance. This indicator measures the difference between what a country earns from its exports and what it spends on imports over a given period.
If a country produces highly sought-after exports, its currency will benefit purely from the extra demand created from foreign buyers seeking to purchase these goods. Therefore, a positive net Trade Balance strengthens a currency and vice versa for a negative balance.


