

- The Pound Sterling tested offers above 1.2700 versus the US Dollar but buyers failed to sustain the move.
- GBP/USD traders shift their focus toward US labor data amid President Trump’s tariff talks.
- The pair failed to sustain above the 100-day SMA; is a fresh downside on the cards?
The Pound Sterling (GBP) demand fizzled against the US Dollar (USD), fuelling a GBP/USD correction from ten-week highs of 1.2716.
Pound Sterling gives in to the USD resurgence
Despite the resilience shown in the first half of the week, the Pound Sterling succumbed to the unabated haven demand for the Greenback in the latter part. The GBP/USD pair, therefore, snapped its three straight weekly gains, pulling back from the levels last seen in December 2024.
The pair’s early advance was sponsored by the expectations of divergent interest rate cut outlooks between the US Federal Reserve (Fed) and the Bank of England (BoE). Despite hot UK inflation data and gloomy economic prospects, the BoE is predicted to implement fewer rate cuts this year.
On the other hand, markets continue pricing in two Fed rate cuts in 2025 in the face of discouraging US economic data that rekindles slowdown concerns. On February 21, the S&P Global said that the US Composite Flash PMI Output Index fell from 52.7 in January to 50.4, marking a 17-month low and fuelling worries over the economic outlook.
This narrative acted as a drag on the US Dollar while supporting the Pound Sterling.
Further weakness in the USD was sponsored by the return of risk appetite as China rolled out fresh rural revitalization measures in its annual rural policy blueprint for 2025. Also, hopes for a potential delay in tariff implementation on Canada and Mexico added to the market optimism, driving GBP/USD to over two-month highs of 1.2716.
However, risk-off flows crept in after the American artificial intelligence (AI) leader Nvidia’s earnings result failed to impress markets. The slump in Nvidia and other so-called “Magnificent Seven” Wall Street mega-cap stocks sparked risk aversion globally, reviving the safe-haven flows into the US currency.
Additionally, US President Donald Trump’s confirmation on Thursday that his proposed 25% tariffs on Mexican and Canadian goods will take effect March 4, along with an extra 10% duty on Chinese imports, following the earlier back and forth, boosted the US Dollar recovery.
Subsequently, the major turned south and gave up the 1.2600 level as well. The Greenback shrugged off dismal US economic data releases and the ongoing sell-off in the US Treasury bond yields amid an increased flight to safety as Trump’s tariff threats returned to the fore.
Data on Thursday showed that the second estimate of the fourth-quarter US Gross Domestic Product (GDP) held steady from the advance estimates, showing an annualised growth of 2.3% in Q4 2024. Meanwhile, the number of Americans filing for jobless benefits rose by 22,000 to 242,000 for the week ending Feb. 22, hitting the highest level in three months.
The final data release from the US showed on Friday that the Personal Consumption Expenditures (PCE) Price Index and the core PCE Price Index both rose 0.3% on a monthly basis in January. These figures matched analysts’ estimate and failed to trigger a noticeable market reaction.
Week ahead: US tariffs and Nonfarm Payrolls in the spotlight
It’s a quiet start to the US Nonfarm Payrolls (NFP) week, barring any volatility infused by US President Donald Trump’s tariff talks over the weekend.
Regarding economic data releases, the US Institute for Supply Management (ISM) Manufacturing Purchasing Managers’ Index (PMI) will be of note for GBP/USD traders on Monday.
Tuesday is data-dry from both sides of the Atlantic. Hence, attention turns to Wednesday’s US Automatic Data Processing (ADP) Employment Change data, followed by the ISM Services PMI report.
Thursday will feature the European Central Bank (ECB) monetary policy announcements, which could have a EUR/GBP cross-driven “rub-off” effect on the Pound Sterling.
The all-important US NFP figure, alongside wage inflation data, will be published on Friday. The data will likely provide a fresh direction on the Fed’s interest rates and the US Dollar, eventually affecting the GBP/USD trades.
Besides the economic data releases, the focus will remain on speeches from Fed policymakers and Trump, having a significant market impact. The Fed enters its ‘blackout’ period on March 8 ahead of the March 18-19 policy meetings.
A couple of BoE officials are also due to speak during the week.

GBP/USD: Technical Outlook
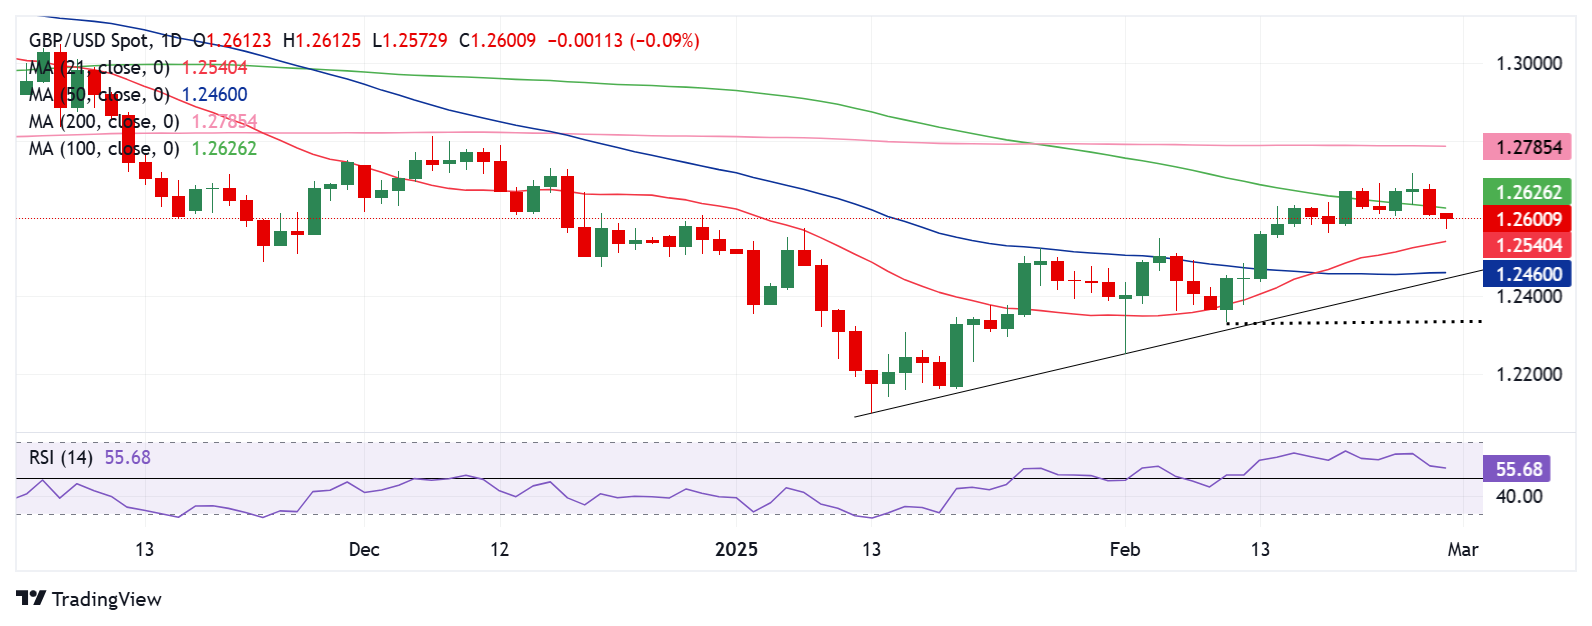
The daily chart shows that GBP/USD failed to stay above the critical 100-day Simple Moving Average (SMA) at 1.2626, having briefly recaptured it in the first half of the week.
The corrective decline in the pair is reflected by the declining 14-day Relative Strength Index (RSI) heading toward the 50 level.
While the leading indicator still holds above the midline, its latest downtrend sparks bearish signals for the major.
Should sellers exert additonal pressure, the immediate downside target is the 21-day SMA at 1.2539.
Further south, the confluence of the 50-day SMA and the rising trendline support near 1.2450 will offer some comfort to buyers.
Their last line of defense is pegged at the February 11 low of 1.2333.
On the flip side, acceptance above the 1.2700 level is critical to unleashing a sustained uptrend toward the 200-day SMA at 1.2785.
The next powerful topside barriers are at the 1.2850 psychological level and the 1.2900 round level.
Nonfarm Payrolls FAQs
Nonfarm Payrolls (NFP) are part of the US Bureau of Labor Statistics monthly jobs report. The Nonfarm Payrolls component specifically measures the change in the number of people employed in the US during the previous month, excluding the farming industry.
The Nonfarm Payrolls figure can influence the decisions of the Federal Reserve by providing a measure of how successfully the Fed is meeting its mandate of fostering full employment and 2% inflation. A relatively high NFP figure means more people are in employment, earning more money and therefore probably spending more. A relatively low Nonfarm Payrolls’ result, on the either hand, could mean people are struggling to find work. The Fed will typically raise interest rates to combat high inflation triggered by low unemployment, and lower them to stimulate a stagnant labor market.
Nonfarm Payrolls generally have a positive correlation with the US Dollar. This means when payrolls’ figures come out higher-than-expected the USD tends to rally and vice versa when they are lower. NFPs influence the US Dollar by virtue of their impact on inflation, monetary policy expectations and interest rates. A higher NFP usually means the Federal Reserve will be more tight in its monetary policy, supporting the USD.
Nonfarm Payrolls are generally negatively-correlated with the price of Gold. This means a higher-than-expected payrolls’ figure will have a depressing effect on the Gold price and vice versa. Higher NFP generally has a positive effect on the value of the USD, and like most major commodities Gold is priced in US Dollars. If the USD gains in value, therefore, it requires less Dollars to buy an ounce of Gold. Also, higher interest rates (typically helped higher NFPs) also lessen the attractiveness of Gold as an investment compared to staying in cash, where the money will at least earn interest.
Nonfarm Payrolls is only one component within a bigger jobs report and it can be overshadowed by the other components. At times, when NFP come out higher-than-forecast, but the Average Weekly Earnings is lower than expected, the market has ignored the potentially inflationary effect of the headline result and interpreted the fall in earnings as deflationary. The Participation Rate and the Average Weekly Hours components can also influence the market reaction, but only in seldom events like the “Great Resignation” or the Global Financial Crisis.


