

- GBP/USD rebounds from monthly lows, trades near 1.2900.
- The near-term technical points to a lack of bullish momentum.
- Intense risk-aversion could continue to limit the pair’s upside.
Following Friday’s sharp decline, GBP/USD continued to push lower at the weekly opening and touched its weakest level in a month below 1.2850. Although the pair managed to stage a rebound, it lost its traction after climbing above 1.2900.
British Pound PRICE Last 7 days
The table below shows the percentage change of British Pound (GBP) against listed major currencies last 7 days. British Pound was the weakest against the Swiss Franc.
| USD | EUR | GBP | JPY | CAD | AUD | NZD | CHF | |
|---|---|---|---|---|---|---|---|---|
| USD | -1.29% | 0.66% | -2.63% | -0.31% | 4.96% | 2.96% | -3.21% | |
| EUR | 1.29% | 2.08% | -1.33% | 1.03% | 6.42% | 4.34% | -1.89% | |
| GBP | -0.66% | -2.08% | -3.34% | -0.97% | 4.25% | 2.25% | -3.85% | |
| JPY | 2.63% | 1.33% | 3.34% | 2.36% | 7.82% | 5.75% | -0.71% | |
| CAD | 0.31% | -1.03% | 0.97% | -2.36% | 5.32% | 3.27% | -2.91% | |
| AUD | -4.96% | -6.42% | -4.25% | -7.82% | -5.32% | -1.93% | -7.83% | |
| NZD | -2.96% | -4.34% | -2.25% | -5.75% | -3.27% | 1.93% | -6.00% | |
| CHF | 3.21% | 1.89% | 3.85% | 0.71% | 2.91% | 7.83% | 6.00% |
The heat map shows percentage changes of major currencies against each other. The base currency is picked from the left column, while the quote currency is picked from the top row. For example, if you pick the British Pound from the left column and move along the horizontal line to the US Dollar, the percentage change displayed in the box will represent GBP (base)/USD (quote).
The US Dollar (USD) gathered strength on Friday and forced GBP/USD to erase its weekly gains. The data published by the US Bureau of Labor Statistics showed that Nonfarm Payrolls rose by 228,000 in March. This reading beat the market expectation of 135,000 by a wide margin and boosted the USD.
Additionally, Federal Reserve (Fed) chairman Jerome Powell said US President Donald Trump’s tariffs are bigger than expected, and that they risk higher inflation and slower growth. “The Fed’s obligation is to make certain that a one-time increase in price levels doesn’t become an ongoing inflation problem,” he added, further supporting the USD.
Over the weekend, US Commerce Secretary Howard Lutnick confirmed that the tariffs will not be postponed and the policy will remain in place for days and weeks. In the meantime, US President Donald Trump said on Sunday that unless the China trade deficit is solved, there will be no deal.
Following these developments, safe-haven flows dominate the action in financial markets on Monday. At the time of press, US stock index futures were down between 3.4% and 4% on the day, while the UK’s FTSE 100 Index was losing more than 4.5%.
In the absence of high-tier data releases, the risk-averse market atmosphere could continue to cap the pair’s upside.
GBP/USD Technical Analysis
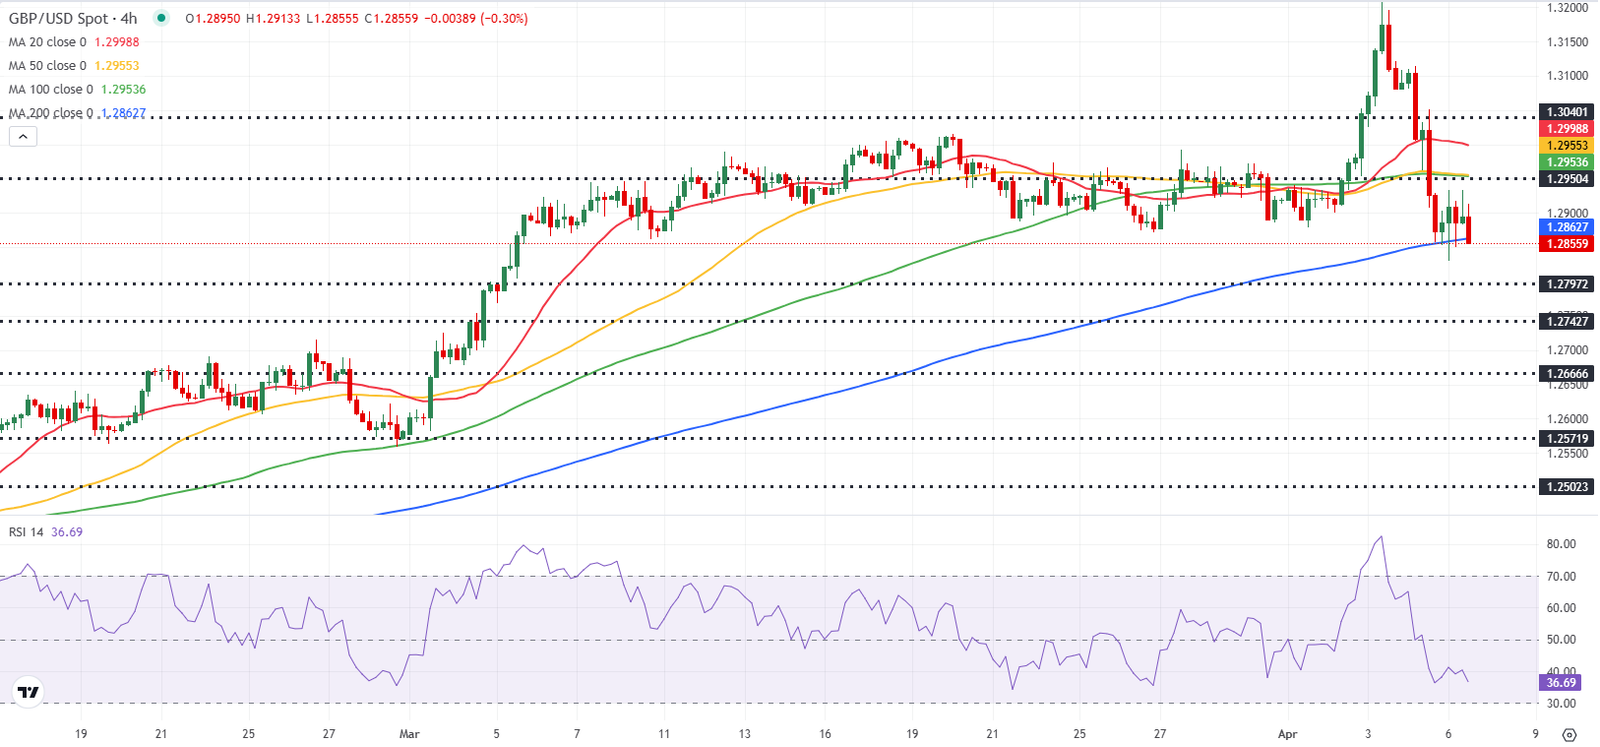
The Relative Strength Index (RSI) indicator on the 4-hour chart stays below 40, reflecting the lack of buyer interest.
The pair was last seen trading near 1.2860, where the 200-period Simple Moving Average (SMA) on the 4-hour chart is located. In case GBP/USD drops below this level and starts using it as resistance, 1.2820 (200-day SMA) could be seen as next support before 1.2740 (static level).
On the upside, first resistance is located at 1.2900 (static level, support level) ahead of 1.2950 (50-period SMA, 100-period SMA) and 1.3000 (round level, static level).
Pound Sterling FAQs
The Pound Sterling (GBP) is the oldest currency in the world (886 AD) and the official currency of the United Kingdom. It is the fourth most traded unit for foreign exchange (FX) in the world, accounting for 12% of all transactions, averaging $630 billion a day, according to 2022 data.
Its key trading pairs are GBP/USD, also known as ‘Cable’, which accounts for 11% of FX, GBP/JPY, or the ‘Dragon’ as it is known by traders (3%), and EUR/GBP (2%). The Pound Sterling is issued by the Bank of England (BoE).
The single most important factor influencing the value of the Pound Sterling is monetary policy decided by the Bank of England. The BoE bases its decisions on whether it has achieved its primary goal of “price stability” – a steady inflation rate of around 2%. Its primary tool for achieving this is the adjustment of interest rates.
When inflation is too high, the BoE will try to rein it in by raising interest rates, making it more expensive for people and businesses to access credit. This is generally positive for GBP, as higher interest rates make the UK a more attractive place for global investors to park their money.
When inflation falls too low it is a sign economic growth is slowing. In this scenario, the BoE will consider lowering interest rates to cheapen credit so businesses will borrow more to invest in growth-generating projects.
Data releases gauge the health of the economy and can impact the value of the Pound Sterling. Indicators such as GDP, Manufacturing and Services PMIs, and employment can all influence the direction of the GBP.
A strong economy is good for Sterling. Not only does it attract more foreign investment but it may encourage the BoE to put up interest rates, which will directly strengthen GBP. Otherwise, if economic data is weak, the Pound Sterling is likely to fall.
Another significant data release for the Pound Sterling is the Trade Balance. This indicator measures the difference between what a country earns from its exports and what it spends on imports over a given period.
If a country produces highly sought-after exports, its currency will benefit purely from the extra demand created from foreign buyers seeking to purchase these goods. Therefore, a positive net Trade Balance strengthens a currency and vice versa for a negative balance.


