- The Pound Sterling tumbled to its lowest level since mid-August against the US Dollar.
- Top-tier US economic data and the UK’s Autumn Budget could rock the GBP/USD pair.
- The Bear Cross on the daily chart keeps the downside open for the Pound Sterling.
The Pound Sterling (GBP) remained at its lowest level in over two months versus the US Dollar (USD), leaving the GBP/USD vulnerable below the 1.3000 threshold.
Pound Sterling dropped and USD popped on safe-haven demand
The demand for the safe-haven USD dominated throughout the week for varied reasons, including the heightened uncertainty leading into the November 5 US presidential election, rising Middle East geopolitical tensions and earnings season globally.
There were no signs of a ceasefire between Israel and Iran, as the former continued to attack the Iran-backed Lebanese militant group Hezbollah in Beirut.
Meanwhile, markets priced in higher chances of a victory for the Republican nominee and the former US President Donald Trump in the presidential race. Trump’s trade and expansionary fiscal policies are seen as inflationary, calling for higher interest rates and the Greenback.
Furthermore, investors remained wary ahead of earnings reports from US titans such as Tesla Inc., Amazon, Google, Nvidia, etc., scurrying for safety in the Greenback. Persistent bets for a less aggressive easing policy likely to be adopted by the Fed also boded well for the buck.
This risk-averse market environment exacerbated the pain in the Pound Sterling, which was already hit a week ago by the increased bets of a Bank of England (BoE) interest rate cut next month after a bigger-than-expected cooldown in the UK inflation for September.
Data released by the Office for National Statistics (ONS) showed on October 16 that the annual UK Consumer Price Index (CPI) inflation fell sharply to 1.7% in September from 2.2% in August, the lowest reading since April 2021.
However, heading into the weekend, the Pound Sterling recovered some ground as the USD rally took a breather ahead of mid-tier US economic data releases. A cautiously optimistic market mood also allowed the risk-sensitive GBP to find some demand.
Top-tier US economic data and UK Budget on tap
Clocks turn back in the UK at the onset of an action-packed week.
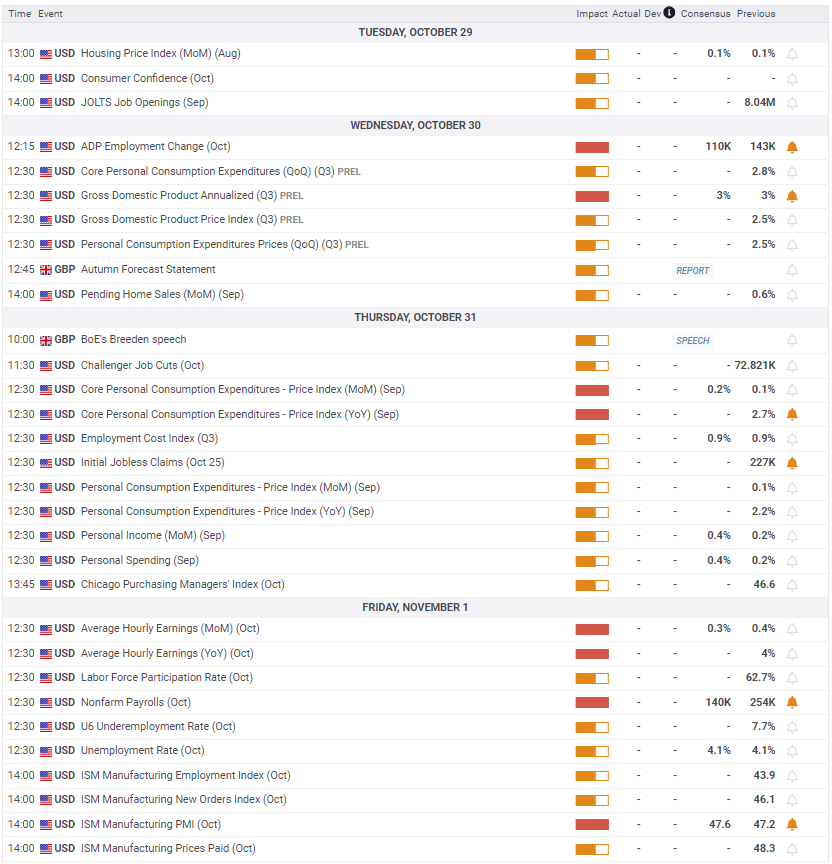
After taking a breather, the market volatility is likely to ramp up in the upcoming week, with a bunch of high-impact economic releases due from the US. Meanwhile, the UK is set to release its Autumn Budget, which could have a significant impact on the local bond market and the Pound Sterling.
Monday is a quiet calendar on both sides of the Atlantic but Tuesday sees the release of the US Conference Board (CB) Consumer Confidence and JOLTS Job Openings data.
On Wednesday, the UK Autumn Budget and the US Automatic Data Processing (ADP) Employment Change data will hog the limelight.
BoE policymaker Sarah Breeden will speak early Thursday while the Fed’s preferred inflation gauge, the core Personal Consumption Expenditures (PCE) Price Index for September, and the Jobless Claims data will be reported later that day in the American trading hours.
The all-important US Nonfarm Payrolls and the wage inflation data will be eagerly awaited on Friday, which will provide fresh hints on the size and the pace of the next Fed rate cuts. The ISM Manufacturing PMI will also hold some relevance heading into the Fed’s ‘blackout period’, starting from Saturday until the November 7 monetary policy meeting.
Amidst a busy calendar, traders will also pay close attention to the Middle East geopolitical risks and the uncertainty around the November 5 US presidential election.
GBP/USD: Technical Outlook
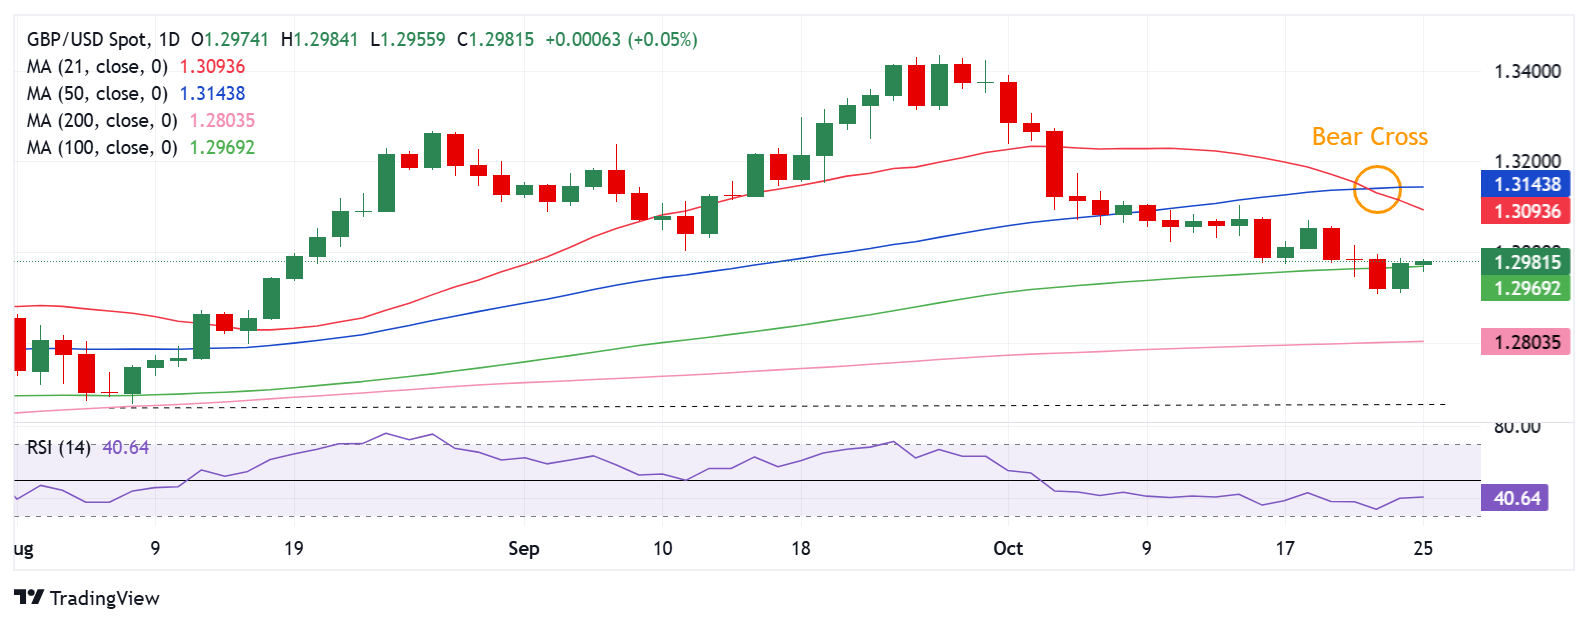
The GBP/USD pair battled the 100-day Simple Moving Average (SMA) at 1.2969 as the downtrend extended into the fourth consecutive week.
A weekly closing below that level could provide fresh zest to Pound Sterling sellers.
The next bearish target is seen at the June 12 high of 1.2861, below which the critical 200-day SMA cap at 1.2803 will be challenged.
If buyers fail to defend that key support, a fresh downside could initiate toward the August 8 low of 1.2665.
The 14-day Relative Strength Index (RSI) holds well below the 50 level, currently near 40, backing the downside bias.
Adding credence to the bearish outlook, the 21-day SMA crossed the 50-day SMA from above on a daily closing basis on Wednesday, charting out a Bear Cross.
On the flip side, a corrective move higher will need a sustained break above the 1.3000 psychological level, followed by the acceptance above the 21-day SMA at 1.3092.
Further up, the 50-day SMA at 1.3143 could be next on the buyers’ radars.
Nonfarm Payrolls FAQs
Nonfarm Payrolls (NFP) are part of the US Bureau of Labor Statistics monthly jobs report. The Nonfarm Payrolls component specifically measures the change in the number of people employed in the US during the previous month, excluding the farming industry.
The Nonfarm Payrolls figure can influence the decisions of the Federal Reserve by providing a measure of how successfully the Fed is meeting its mandate of fostering full employment and 2% inflation. A relatively high NFP figure means more people are in employment, earning more money and therefore probably spending more. A relatively low Nonfarm Payrolls’ result, on the either hand, could mean people are struggling to find work. The Fed will typically raise interest rates to combat high inflation triggered by low unemployment, and lower them to stimulate a stagnant labor market.
Nonfarm Payrolls generally have a positive correlation with the US Dollar. This means when payrolls’ figures come out higher-than-expected the USD tends to rally and vice versa when they are lower. NFPs influence the US Dollar by virtue of their impact on inflation, monetary policy expectations and interest rates. A higher NFP usually means the Federal Reserve will be more tight in its monetary policy, supporting the USD.
Nonfarm Payrolls are generally negatively-correlated with the price of Gold. This means a higher-than-expected payrolls’ figure will have a depressing effect on the Gold price and vice versa. Higher NFP generally has a positive effect on the value of the USD, and like most major commodities Gold is priced in US Dollars. If the USD gains in value, therefore, it requires less Dollars to buy an ounce of Gold. Also, higher interest rates (typically helped higher NFPs) also lessen the attractiveness of Gold as an investment compared to staying in cash, where the money will at least earn interest.
Nonfarm Payrolls is only one component within a bigger jobs report and it can be overshadowed by the other components. At times, when NFP come out higher-than-forecast, but the Average Weekly Earnings is lower than expected, the market has ignored the potentially inflationary effect of the headline result and interpreted the fall in earnings as deflationary. The Participation Rate and the Average Weekly Hours components can also influence the market reaction, but only in seldom events like the “Great Resignation” or the Global Financial Crisis.


