
May 1998
When a country’s foreign exchange market is under pressure, that pressure is typically
reflected in exchange rates, international reserves, interest rates, and the temporary
imposition of controls on credit or foreign exchange transactions. The combination
depends on the circumstances of the particular country affected and on the defensive strategy
chosen by the authorities. In some cases, currency crises also spill over into (or are caused
by) other asset markets, including banking, equity and bond markets. When the authorities are
unable to regain the confidence of markets on their own, they may ask the IMF and the World
Bank, along with other countries, for assistance. As background to the subsequent discussion on
origins, this part of the paper reviews the main developments.
2.1 Exchange Rates
2.1 Exchange Rates
Although the Thai baht had been subject to episodic pressures during the previous 18 months, it
was the intensification of these pressures in May 1997 and the subsequent forced floating of the
baht on 2 July that really ushered in the recent turbulence in
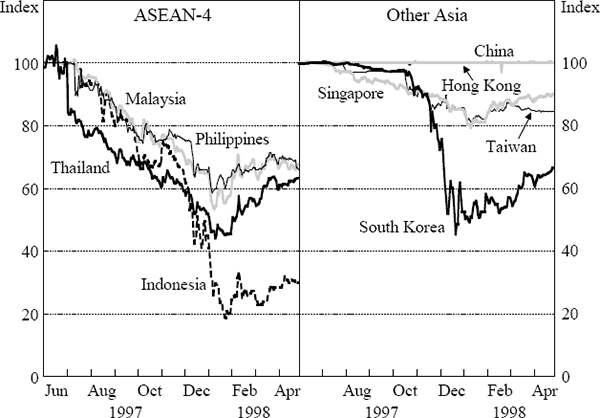
currency and equity markets. As shown in Figure 1, the second half of 1997 and the first weeks
of 1998 witnessed sharp declines in the dollar exchange rates of the ASEAN-4 economies. The
worst affected was the Indonesian rupiah, which at one stage was worth only a fifth of its June
1997 value against the US dollar. The baht itself lost half its value while the Malaysian
ringgit and Philippines peso were down around 40 per cent at their lows. There were more modest
declines in the Singapore and Taiwan dollars over the same period. South Korea’s currency
initially held up better but depreciated heavily in November and December 1997, also losing half
its value by the low point. The Hong Kong dollar maintained its parity despite strong market
pressure and the Chinese renminbi was little affected. With hindsight, January 1998
now appears to have marked the worst of the depreciations. All the affected currencies regained
some strength during the first quarter of 1998. The recovery has been most hesitant in
Indonesia, the economy about which most uncertainties remain.
Figure 1: Bilateral Exchange Rates
Against US$, June 1997 = 100
Sources:
Bloomberg and Datastream
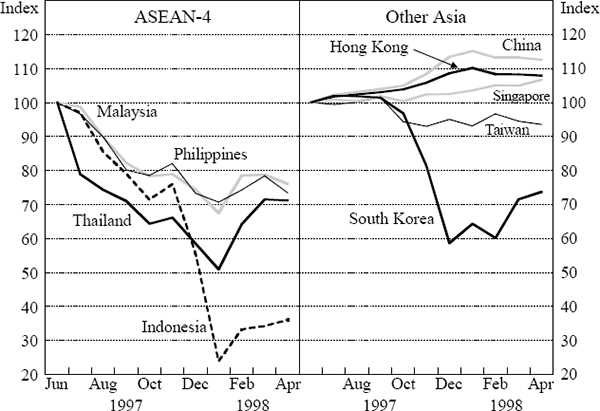
On an effective (i.e. trade-weighted) basis, the ASEAN-4 and Korean currencies recorded slightly
smaller depreciations, the Singapore and Taiwan dollars were relatively stable while the Hong
Kong dollar and Renminbi appreciated.
(Figure 2.)
Figure 2: Effective Exchange Rates
June 1997 = 100
Source:
Reserve Bank of Australia
Real effective exchange rates over the 1990s are shown in Figure 3 for seven Asian emerging
economies. Two observations merit mention. First, the combination of the close (explicit or
implicit) tracking of the US dollar by many Asian currencies and large swings in the yen-dollar
exchange rate have meant that the ASEAN-4 currencies have shown marked medium-term fluctuations
both with respect to the yen and to a wider trade-weighted basket of exchange rates.
Specifically, after depreciating vis-à-vis the yen in the first
half of the 1990s, the ASEAN-4 currencies displayed real appreciation relative to the yen
between early 1995 and mid 1997. Their real effective exchange rates showed the same pattern,
albeit much damped in magnitude. These real appreciations relative to non-dollar currencies in
the 18 month run-up to the current crisis are noteworthy because they presumably contributed to
any market concerns about overall exchange rate overvaluation.
Figure 3: Real Effective Exchange Rates
July 1987 – June 1997 = 100
Source:
JP Morgan
Second, the recent depreciations of the ASEAN-4 currencies have come from different levels of
their real effective exchange rates (relative to historical averages). Whereas the real
effective exchange rates of both the Philippine peso and the Singapore dollar were around 15 per
cent above their average level of the previous decade prior to the recent fall, the Thai baht
and Indonesian rupiah were less than 10 per cent above and the
South Korean won was below its medium-term average. (Figure 3).
This comparison of movements of real effective exchange rates in the 1990s suggests that,
uncertainty about equilibrium real exchange rates notwithstanding, in mid 1997 the extent of any
exchange rate misalignments was quite modest in comparison with the size of the subsequent
depreciations.
The size of the Asian depreciations is placed into perspective in Table 1. This shows the 20
largest real effective depreciations over six-month periods since 1970 (excluding countries with
inflation over 50 per cent as such calculations are unreliable
during hyperinflations). By comparison, the largest six-monthly change in the G3 currencies over
this period was the 1995 real depreciation in the yen of around 20 per cent; some European
currencies recorded similar real depreciations in the ERM crisis and the Australian dollar had a
similar real depreciation in the mid 1980s. Taking Table 1 and Figure 3 together one gets an
impression of just ‘how large’ have been these real depreciations in emerging Asia,
both with respect to historical experience and to simple proxies for equilibrium rates.
| Kuwait | 1990 | −74 |
|---|---|---|
| Nigeria | 1986 | −74 |
| Indonesia | 1998 | −68 |
| Pakistan | 1972 | −55 |
| Venezuela | 1986 | −45 |
| Turkey | 1970 | −42 |
| Venezuela | 1984 | −41 |
| Mexico | 1995 | −40 |
| South Korea | 1998 | −36 |
| Malaysia | 1998 | −35 |
| Nigeria | 1992 | −34 |
| Indonesia | 1978 | −33 |
| Thailand | 1998 | −33 |
| Mexico | 1976 | −32 |
| Ecuador | 1984 | −31 |
| Ecuador | 1986 | −30 |
| Philippines | 1970 | −29 |
| Indonesia | 1986 | −29 |
| South Africa | 1985 | −26 |
| Chile | 1982 | −25 |
|
Source: JP Morgan real effective exchange rates based on price
|
||
2.2 Exchange Market Intervention
2.2 Exchange Market Intervention
It is not straightforward to describe the role played by exchange market intervention as
available data capture only part of these operations. Although the concept most relevant for
vulnerability to a speculative attack would be net international reserves relative to some
measure of potential liquid liabilities of the authorities (Section 3.1), published data generally refer only
to gross reserves and thus miss intervention by the authorities in the forward market. As widely
reported, such forward market operations were an important element of the Thai defence,
involving a position which peaked at US$24 billion. The
individual-country reserve figures may also miss co-ordinated intervention undertaken in support
of currencies by (third party) monetary authorities or intervention that is funded through a
country’s fiscal accounts rather than its international reserves. Furthermore, it has been
suggested that some of the Korean international reserves were not useable as they had been lent
to banks.
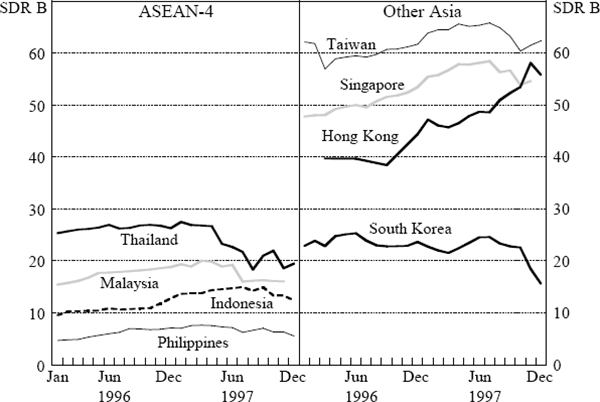
With these caveats in mind, Figure 4 shows the behaviour of gross international reserves over
the 1996–1997 period for eight Asian economies. It shows that Thailand and South Korea
initially relied much more on their reserves in defending the exchange rate than did Indonesia,
Malaysia or the Philippines. One interpretation is that the Malaysian and Indonesian authorities
were mindful of the large reserve losses suffered not only by Thailand but also by some other
countries in earlier vigorous but ultimately unsuccessful currency defences (e.g., the huge
interventions during the ERM crisis) and decided not to go far down that road; that is, they
intervened heavily for a short period and then turned to other measures. In the case of the
Philippines, low initial reserve levels dictated limited reliance on intervention as part of the
defensive strategy. Figure 4 also illustrates the large reserve holdings of Hong Kong, Singapore
and Taiwan relative to the ASEAN-4 countries. Despite its large stock of reserves, Taiwan opted
on 20 October to allow its currency to depreciate.
Figure 4: Gross International Reserves
SDR billions
Source:
IMF International Financial Statistics
2.3 Interest Rates and Credit Controls
2.3 Interest Rates and Credit Controls
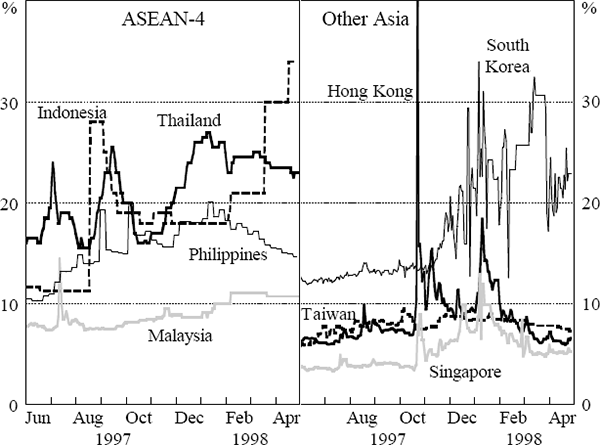
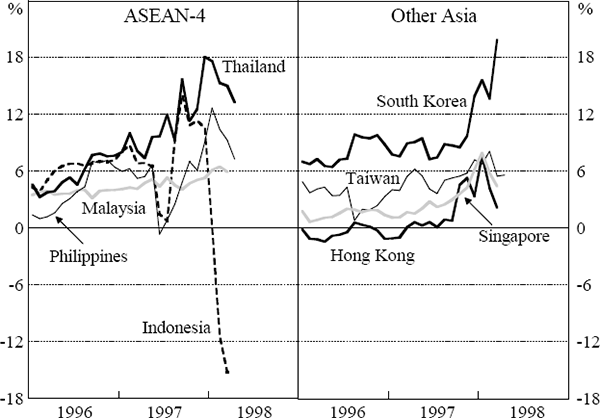
An important element in most currency defences is played by short-term interest rates. These are
shown in Figure 5, with corresponding real rates shown in Figure 6. Four developments
should be noted. Firstly, the ASEAN-4 countries and South Korea had increased interest rates
during 1996, either to rein back excessive credit growth or support the exchange rate.
Consequently, they found themselves in the first quarter of 1997 with already high short-term
real interest rates. Some might argue these high interest rates increased the vulnerability to
attack because efforts by speculators to push up the cost of ‘holding on’ to
exchange rate commitments begun from a relatively high base.
Figure 5: 90-day Interest Rates
Sources:
Bloomberg and Datastream
Figure 6: Real Short-term Interest Rates
Sources:
Bloomberg and Datastream (see footnote 6).
Secondly, as exchange market pressures intensified in 1997, each of the ASEAN-4 countries
further increased short-term interest rates to combat those pressures. As shown in Figure 5,
short-term (nominal) interest rates in Thailand and Indonesia displayed high volatility in 1997,
especially from May onwards; in some episodes, government policies and market pressures drove
overnight rates to very high levels (near 100 per cent in Indonesia, and over 350 per cent in
the offshore Thai market), albeit for relatively short time periods. Malaysia’s use of high
interest rates was the most limited among the ASEAN-4 countries. There was a large spike in
early July but rates then returned to pre-crisis levels.
Thirdly, reminiscent of the tactics employed by several European countries during the 1992–93
ERM crisis (e.g., France, Ireland, Portugal and Spain), each of the ASEAN-4 countries resorted
to a mixture of administrative controls, taxes, and moral suasion, aimed at discouraging capital
outflows and short sales of both the domestic currency and domestic equities, and at reducing
the need for even larger increases in domestic interest rates. In May 1997, the Thai
authorities introduced restrictions on the ability of local banks to extend baht credit to
offshore banks, to conduct foreign exchange swaps (baht for dollars), and to sell baht for
dollars to speculators in the spot offshore market. In July, the Philippines authorities
prohibited local banks for three months from engaging in offshore, nondeliverable forward peso
contracts with offshore banks, and there are reports that the central bank also used moral
suasion to discourage local banks from making peso credit available to those who might be
expected to use it to speculate against the peso. The Indonesian authorities resisted for longer
any temptation to impose capital controls but in August introduced limits on foreigners’
access to swap markets. In Malaysia, a ban on short selling of equities was introduced but was
soon lifted. A $20 billion plan was also announced to support stock prices, under which shares
sold by Malaysians to state pension and investment funds would fetch a premium whereas shares
sold by foreigners would occur at market prices. In addition, Prime Minister Mahathir has
threatened on several occasions to introduce controls on foreign exchange trading but these have
not been implemented. When the Hong Kong dollar was under strong attack in late October,
Hongkong and Shanghai Banking Corporation (a private bank, but one that undertook some central
bank functions before the establishment of the Hong Kong Monetary Authority) temporarily
restricted withdrawals on time deposits to aid in the currency’s defence.
While it is difficult to know how exchange and interest rates would have behaved in the second
half of 1997 in the absence of these administrative measures, one thing is clear: as in the ERM
crisis, such administrative measures did not prevent ASEAN-4 exchange rates from declining
sharply, nor did they obviate the need for domestic interest rates to increase significantly.
2.4 Equity Prices
2.4 Equity Prices
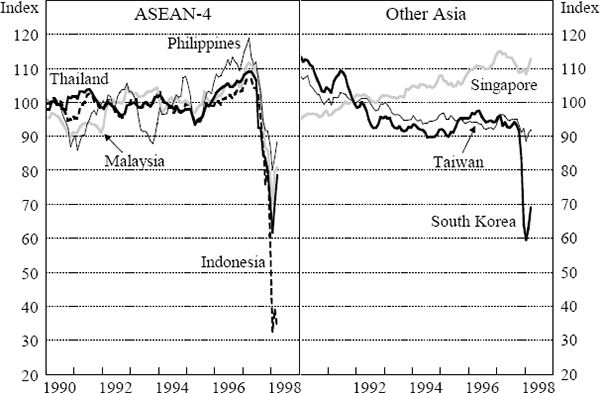
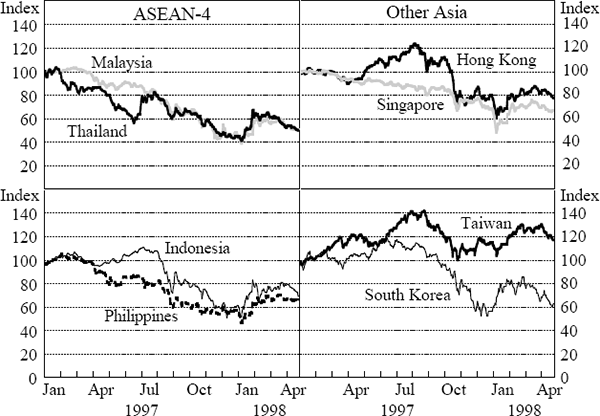
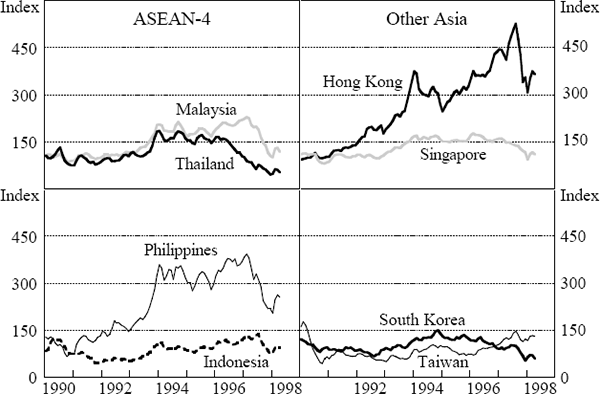
Figures 7 and 8 trace the evolution of equity prices in eight Asian emerging economies, in the
short term (since January 1997) and medium-term (since 1990), respectively. The ASEAN-4
countries suffered steep falls in their equity markets in the second half of 1997. As regards
the four other Asian emerging economies shown, Hong Kong and South
Korea registered falls comparable with those in three of the ASEAN-4 countries, whereas the
decline has been more moderate (around 20 per cent) in Singapore and Taiwan. As with their
exchange rates, the equity markets turned around in January 1998. By April 1998, most were
higher than at the start of the year, but still well down on mid 1997.
Figure 7: Asian Equity Prices
January 1997 = 100
Source:
Datastream
Figure 8: Asian Equity Prices
Monthly data; 1990 = 100
Source:
Datastream
Turning to equity prices over the medium term, there are again significant differences across
countries. Most dramatically, even before the crisis, Thai stock prices had fallen by over 60
per cent from their peak in early 1994 and by end 1997 were about half their level at the
beginning of the decade. In contrast, stock prices had tripled in the Philippines over this
decade, doubled in Malaysia and risen by 60 per cent in Indonesia.
The other east Asian emerging economies whose stock market performance in the 1990s have been as
disappointing as Thailand’s are South Korea and Taiwan. In the former, stock prices have
fallen over 60 per cent since the peak (in late 1994) and by end
1997 were about half their 1990 level. In contrast, even after the sharp fall in late 1997, Hong
Kong’s Hang Seng index had gone up over threefold since the beginning of the decade.
The behaviour of equity markets is important because they serve as an alternative to bank
financing for some companies, because sharp changes in stock prices can generate non-trivial
wealth effects, because banks either use equities as collateral for bank loans and/or invest
themselves in equities, and because they are an important channel for foreign capital inflows.
Moreover, they are often regarded as a barometer of confidence in the domestic economy and as
either an early warning signal or precipitating factor in many past financial crises in emerging
economies.
2.5 Real Impact of the Financial Problems
2.5 Real Impact of the Financial Problems
One immediate effect of the financial crisis has been a contraction in real activity. In
Thailand, this is already apparent in the industrial production data which was 17 per cent lower
in January 1998 than in January 1997. The other economies were later to suffer their financial
problems and there are longer lags in data releases. However, an indication of the magnitude of
the problem can be gleaned from a comparison of the ‘consensus’ growth forecasts for
1998 made in June 1997 with the latest forecasts made in April 1998. (The revision should
capture the impact of the financial crisis rather than any other factors thought likely to slow
output before the crisis.) Indonesia, Thailand and South Korea are the economies whose growth
has been most marked down, and the downgrades are the most severe recorded in the 1990s. Real
GDP is now expected to contract this year, despite the stimulus to net exports from their
depreciations, reflecting, inter alia, high interest rates, vastly increased foreign
currency debt obligations, more widespread corporate and banking failures, higher layoffs, and
the generalised uncertainty and loss of confidence associated with such crises.
| 1996 | 1997(e) | 1998 | 1988 | ||
|---|---|---|---|---|---|
| June 97 forecast |
April 98 forecast |
(Change in 1998 forecast) |
|||
| Indonesia | 7.8 | 4.6 | 7.6 | −6.3 | (−13.9) |
| Thailand | 6.4 | 0.0 | 5.9 | −4.1 | (−10.0) |
| South Korea | 7.1 | 5.5 | 6.1 | −1.6 | (−7.7) |
| Malaysia | 8.6 | 7.8 | 8.0 | 1.1 | (−6.9) |
| Singapore | 6.9 | 7.8 | 7.3 | 2.7 | (−4.6) |
| China | 9.7 | 8.8 | 10.4 | 7.8 | (−2.6) |
| Philippines | 5.7 | 5.1 | 6.3 | 2.2 | (−4.1) |
| Hong Kong | 5.0 | 5.2 | 5.5 | 3.0 | (−2.5) |
| Taiwan | 5.7 | 6.8 | 6.5 | 5.9 | (−0.6) |
|
Source: Consensus Economics Inc Asia-Pacific Consensus
|
|||||
There should be large movements in the current accounts of the affected economies. Mexico
changed its current account position by 6 per cent of GDP in the first year after its mid 1990s
crisis. Already South Korea and Thailand have recorded some monthly current account surpluses.
The April consensus forecasts imply the combined merchandise trade balance of Indonesia,
Thailand and South Korea would rise by almost US$50 billion between 1997 and 1999.
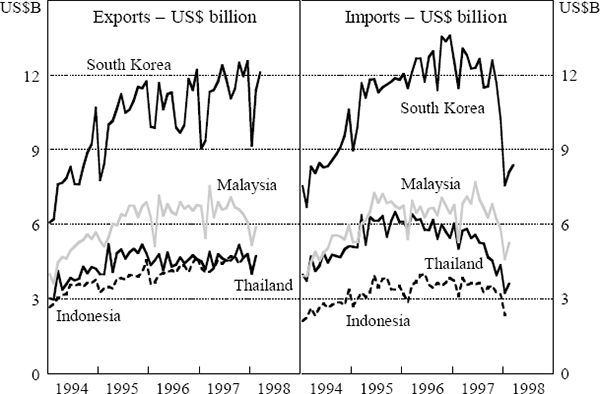
However, the available data thus far, illustrated in Figure 9, as well as the forecasts for
1998, indicate that in the short term the change in trade balances will mainly come from a sharp
reduction in imports. At least thus far, the competitiveness benefits for exporters seem to be
outweighed by other factors such as difficulties in exporters attracting finance or collapse of
neighbouring markets.
Figure 9: Asian Merchandise Trade
Sources:
Bloomberg and Datastream
These data refer to the US dollar value of merchandise exports and imports.
Stability in US dollar value of exports would be consistent with increased export volumes (and
so greater real GDP) if prices are being cut in US dollar terms, but still mean that exports are
not helping to rebuild reserves or increase national income.
2.6 International Rescue Packages
2.6 International Rescue Packages
IMF-led rescue packages have been assembled for Thailand, Indonesia and South Korea. Table 3
compares them with the previous largest rescue package, for Mexico in 1995. The IMF
contributions are large, especially relative to the size of their quotas (usually loans do not
exceed two or three times a quota) and the contributions from the rest of the world are also
substantial. Japan has been the largest contributor, followed by the US, although the latter was
not involved with the Thai package. It is noteworthy that Japan also has the largest share of
bank lending to the crisis countries, followed by Europe (principally Germany, France and the
United Kingdom), Hong Kong and the United States (Table 4).
| Thailand | Indonesia | South Korea | Mexico | |
|---|---|---|---|---|
| Date agreed | 20 Aug 97 | 5 Nov 97 | 4 Dec 97 | 1 Feb 95 |
| Latest revision | 24 Feb 98 | 10 Apr 98 | 7 Feb 98 | |
| Total (US$bn) | 17 | 35 | 58 | 52 |
| of which: | ||||
| IMF | 3.9 | 9.9 | 20.9 | 17.8 |
| World Bank | 1.5 | 4.5 | 10 | 2.8(a) |
| ADB | 1.2 | 3.5 | 4 | |
| BIS/G10 | 10 | |||
| USA | 3 | 5 | 20 | |
| Europe | 6.3 | |||
| Canada | 1 | |||
| Australia | 1 | 1 | 1 | |
| Brunei | 0.5 | |||
| China | 1 | 1 | ||
| Hong Kong | 1 | 1 | ||
| Indonesia | 0.5 | |||
| Japan | 4 | 5 | 10 | |
| Malaysia | 1 | 1 | ||
| New Zealand | 0.1 | |||
| Singapore | 1 | 5 | ||
| South Korea | 0.5 | |||
| IMF disbursements as at 10 Apr 98 | 2.7 | 3.0 | 15.1 | |
| Time period | 34 months | 36 months | 36 months | |
| % of IMF quota | 505 | 490 | 1,939 | 688 |
| Targets (1998) | original | (latest revised) | (1995) | |
| Real GDP(b) | 3.5 (−3) | 3 (−5) | 2.5 (−1) | 1.5 |
| Inflation(b) | 5 (11) | 9 (45) | 5 (<10) | 9 by end 95 |
| Current account(c) | −3 (+4) | −2 (+3) | −2 (+5) | −4 |
| Budget balance(c) | 1 (−1½) | 1 (−4) | 0 (−2) | 0.5 |
|
Notes: (a) World Bank and Inter-American Development Bank
Sources: Compiled from IMF website (www.imf.org); Commonwealth
|
||||
| Japan |
Germany |
France |
United States | United Kingdom | Hong Kong | Total |
|
|---|---|---|---|---|---|---|---|
| to: | |||||||
| Indonesia | 23 | 6 | 5 | 5 | 4 | 6 | 61 |
| Thailand | 38 | 8 | 5 | 4 | 3 | 18 | 99 |
| S. Korea | 24 | 11 | 10 | 10 | 6 | 23 | 117 |
| Malaysia | 10 | 6 | 3 | 2 | 2 | 3 | 33 |
| Philippines | 2 | 2 | 2 | 3 | 1 | 4 | 17 |
| Total | 97 | 32 | 25 | 24 | 16 | 53 | 326 |
| Memo | |||||||
| Mexico (June 94) |
4 | 4 | 3 | 20 | 10 | 0 | 71 |
|
Sources: G5 data from Bank for International Settlements The
|
|||||||
The packages have been subject to substantial revision, notably making the budgetary demands
less onerous, as the economic outlook for the economies has deteriorated. No international
package has been sought by Malaysia, although it has voluntarily undertaken some reforms. The
Philippines agreed in July 1997 to strengthen an ongoing IMF adjustment programme and received
access to over US$1 billion in additional financing.
The IMF’s assistance is subject to policy conditionality and in many cases the supplementary
facilities offered by other countries are also contingent on compliance with these conditions.
The performance criteria on monetary and fiscal policies have presumably been set with an eye
toward improving the current account, providing some government contribution to the cost of bank
restructuring, maintaining control of inflation, and braking the downward slide in exchange
rates. The original growth targets in these programmes have had to be revised downward, as
evidence accumulated that the breadth and depth of the crisis would be greater than anticipated.
The international rescue targets, in effect, put constraints not only on exchange market
intervention but also on the extent to which IMF resources can be used for other purposes.
A distinguishing feature of these rescue packages is that they go much further into reform of
the financial sector and corporate governance than most IMF programmes; see Tables 5 and 6.
Common elements of the required conditions include improved prudential supervision of the
financial system, privatisation and removal of anti-competitive practices.
| Thailand | Up-front separation, suspension and restructuring of unviable institutions …
broader structural reforms to restore a healthy financial sector … all remaining financial institutions to strengthen their capital base expeditiously. |
|---|---|
| Indonesia | The establishment of the Indonesian Bank Restructuring Agency … [which]
intervened in the 54 banks that had [large] emergency borrowings from Bank Indonesia … some 250 examiners were placed in these banks to monitor the banks’ compliance with additional prudential restrictions on, for instance, new credits and payments of dividends … the Government will establish an Asset Management Company to focus on the debt recovery of troubled assets … the government is also proceeding with the merger of state owned banks … BI promulgated new classification and loan loss provisions based on international standards … by June the Government will introduce into parliament a law eliminating existing restrictions on foreign ownership of banks. |
| South Korea | [An exit policy] to ensure the rapid resolution of troubled financial institutions
in a manner which minimises systemic distress and avoids moral hazard … the restructuring and recapitalisation of all banks that fail to meet the Basle Committee capital standards … this policy will include mergers and acquisitions by domestic and foreign institutions … eliminate the [deposit] guarantee by the end of 2,000 and replace it by a regular deposit insurance system that will only protect small depositors and be financed solely by contributions from the financial sector. [Large banks] will be required to have their financial statements audited by internationally recognised firms. Disclosure standards will require the publication of … non performing loans, capital adequacy and ownership structures and affiliations. [Legislation will] consolidate the supervisory functions [and] allow prompt close of insolvent financial institutions. The authorities will allow foreigners to establish bank subsidiaries and brokerage houses by mid 1998. |
|
Source: Compiled from documents on the IMF website
|
|
| Thailand | New bankruptcy law will permit corporate reorganisations; increase the scope for
out-of-court workouts and ensure fair treatment of creditors. |
|---|---|
| Indonesia | Over the longer term, at a minimum, all enterprises that operate in competitive
markets will be privatised, with the government retaining only selected public utilities and strategic companies … the Government will eliminate all restrictions on foreign investment in wholesale trade and establish a level playing field in the import and distribution of essential food items … the Government will implement by September 1998 the necessary regulations establishing guidelines and clear procedures and mechanisms for mergers, acquisitions and exit which facilitate efficient corporate restructuring while safeguarding against anticompetitive or predatory behaviour. |
| South Korea | Require financial statements of listed companies to be prepared and audited in
accordance with international standards, require publication of combined financial statements for associated companies, further reduce the use of mutual guarantees by affiliates/subsidiaries, increase the degree of independence of CPAs … require listed companies to have at least one outside director, remove restrictions on voting rights of institutional investors in listed companies, strengthen minority shareholders’ rights by substantially lowering the thresholds on exercising these rights, review the possibility of allowing for class action suits against corporate executives and auditors … ensure that all corporate restructuring is voluntary and market-oriented, liberalisation of the domestic mergers and acquisitions by removing the mandatory tender offer requirement, permit takeovers of non-strategic Korean corporations by foreign investors without government approval … amend bankruptcy law to facilitate more rapid resolution of bankruptcy proceedings. |
|
Sources: Compiled from letters of intent sent to IMF from Thailand
|
|
The rationale for including corporate governance and transparency elements in these programmes
reflects the view that weaknesses in this structural area (non-consolidated accounting
statements, overleveraged conglomerates, cross-company shareholding arrangements and guarantees,
inefficient government monopolies and cartels, absence of official subsidies from published
government budget accounts, etc) were one of the underlying elements of vulnerability.