
The Pound Sterling advances on Wednesday during the North American session, up 0.15% at 1.3560, with no clear catalyst behind the move, as the conflict in the Middle East prolongs, while traders brace for US inflation data release.
GBP/USD firms despite surging crude as traders await US inflation
Energy prices are soaring, with West Texas Intermediate (WTI), the US crude Oil benchmark, rising over 2%, hurdling the $96.00 threshold. Iran’s attack on US warships triggered a reaction by Washington, which attacked Iran’s tankers. Meanwhile, the positive correlation between WTI and the Greenback has broken, as the Dollar weakens.
The US Dollar Index (DXY), which measures the performance of the buck versus six major currencies, is down 0.19% at 98.64.
US jobs data exceeded estimates, with the ADP Employment Change 4-week average at 12K, up from the previous week’s downward-revised print of 10K. Eyes turn to US inflation data, first with the PPI on Thursday, followed by Friday’s CPI.
Fed expected to hike; BoE to hold
If both reports exceed forecasts, that will cement the case for a rate hike by the Federal Reserve. Money markets indicate investors expect a quarter-point rate hike at the September 15-16 meeting. Odds stand at 63%, while hold odds are near 37%.
Regarding the Bank of England, it is expected to hold rates at 3.75% at the September 17 meeting, with odds of 86%.
On Friday, the Office for National Statistics (ONS) will unveil its Gross Domestic Product (GDP) data.
GBP/USD Price Forecast: Technical Outlook
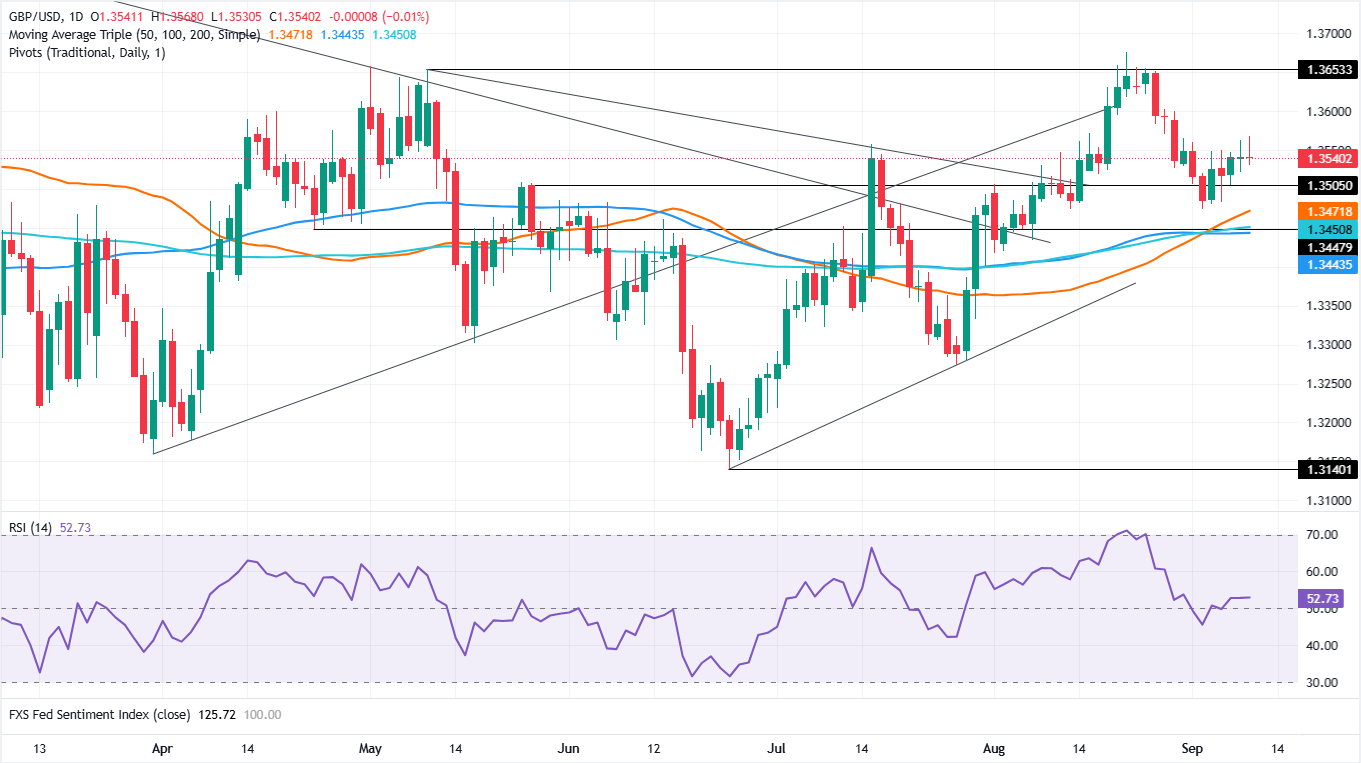
In the daily chart, GBP/USD trades at 1.3540, holding a constructive near-term bullish bias as spot remains above the simple moving average cluster around 1.3472 and the former descending trend-line barrier now turned support near 1.3365. The Relative Strength Index (14) at 52.7 stays close to neutral, hinting at steady rather than aggressive buying pressure, while an upward-sloping support line from 1.3140 underpins the broader recovery ahead of the higher, now-protective trend-line break level at 1.3672.
On the downside, initial support is located at the moving average band and recent trend-line confluence between 1.3472 and 1.3469, ahead of the secondary structural floor around 1.3444 and the deeper former resistance-turned-support zone at 1.3365. On the topside, a key hurdle emerges at the upward trend-line break price of 1.3672, and sustained trading above that level would reinforce the bullish tone and open the way for a more extended advance.
(The technical analysis of this story was written with the help of an AI tool. Know more.)
Pound Sterling Price Today
The table below shows the percentage change of British Pound (GBP) against listed major currencies today. British Pound was the strongest against the New Zealand Dollar.
| USD | EUR | GBP | JPY | CAD | AUD | NZD | CHF | |
|---|---|---|---|---|---|---|---|---|
| USD | 0.01% | 0.00% | -0.14% | 0.21% | 0.05% | 0.23% | 0.11% | |
| EUR | -0.01% | 0.00% | -0.14% | 0.21% | 0.03% | 0.22% | 0.11% | |
| GBP | -0.00% | -0.00% | -0.12% | 0.22% | 0.05% | 0.23% | 0.13% | |
| JPY | 0.14% | 0.14% | 0.12% | 0.35% | 0.19% | 0.33% | 0.26% | |
| CAD | -0.21% | -0.21% | -0.22% | -0.35% | -0.16% | 0.00% | -0.09% | |
| AUD | -0.05% | -0.03% | -0.05% | -0.19% | 0.16% | 0.18% | 0.08% | |
| NZD | -0.23% | -0.22% | -0.23% | -0.33% | -0.01% | -0.18% | -0.10% | |
| CHF | -0.11% | -0.11% | -0.13% | -0.26% | 0.09% | -0.08% | 0.10% |
The heat map shows percentage changes of major currencies against each other. The base currency is picked from the left column, while the quote currency is picked from the top row. For example, if you pick the British Pound from the left column and move along the horizontal line to the US Dollar, the percentage change displayed in the box will represent GBP (base)/USD (quote).