

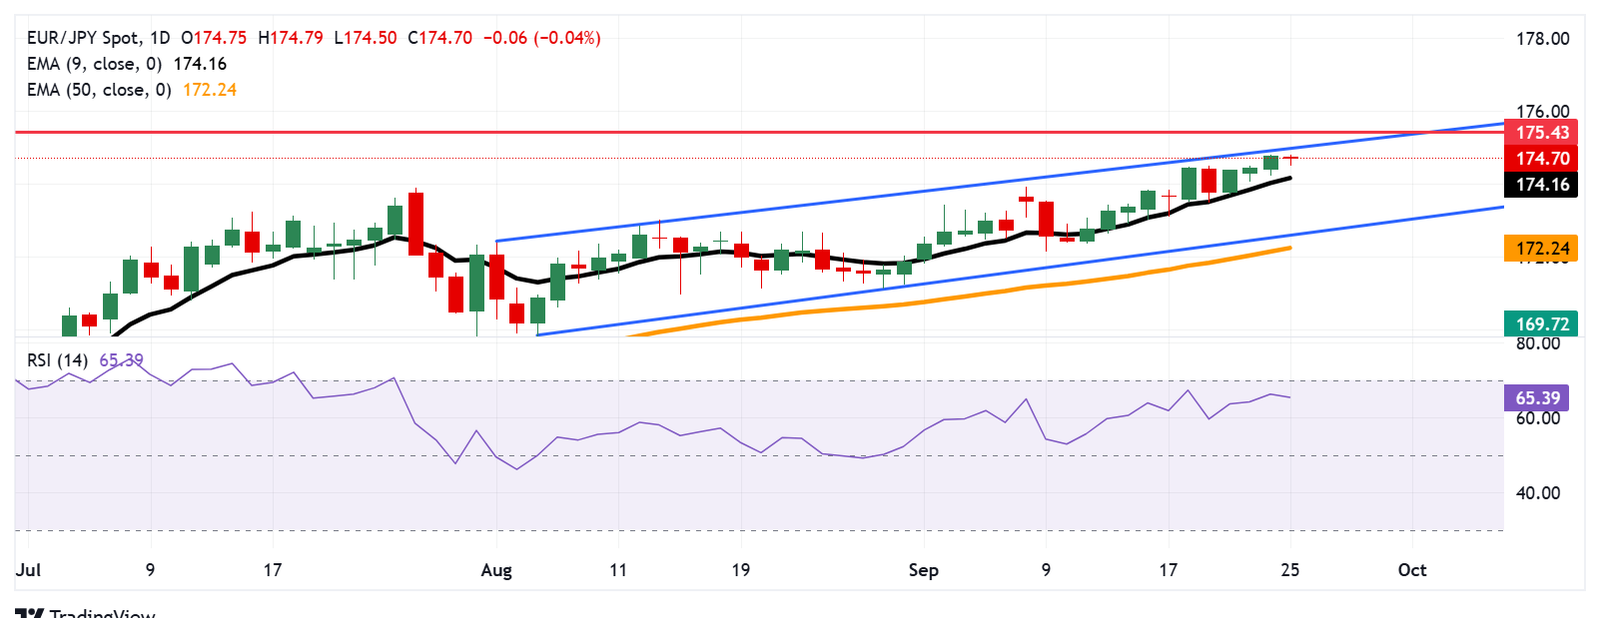
- EUR/JPY may test the upper boundary of the ascending channel at 175.00.
- The 14-day Relative Strength Index stays above 50, reinforcing the bullish outlook.
- The primary support lies at the nine-day EMA of 174.16.
EUR/JPY halts its three-day winning streak, trading around 174.70 during the Asian hours on Thursday. The currency cross holds losses ahead of the German GfK Consumer Confidence Survey due later in the day.
The technical analysis of the daily chart indicates an ongoing bullish bias as the currency cross moves upwards within the ascending channel pattern. The 14-day Relative Strength Index (RSI) remains above the 50 mark, strengthening the bullish bias. Additionally, the short-term price momentum is stronger as the EUR/JPY cross holds above the nine-day Exponential Moving Average (EMA).
On the upside, the EUR/JPY cross may test the upper boundary of the ascending channel around the psychological level of 175.00. A break above the channel would strengthen the bullish bias and support the currency cross to explore the region around the all-time high of 175.43, reached in July 2024.
The initial support lies at the nine-day EMA of 174.16. A break below this level would weaken the short-term price momentum and prompt the EUR/JPY cross to navigate the region around the ascending channel’s lower boundary, around 172.70, followed by the 50-day EMA at 172.24.
EUR/JPY: Daily Chart
Euro Price Today
The table below shows the percentage change of Euro (EUR) against listed major currencies today. Euro was the weakest against the New Zealand Dollar.
| USD | EUR | GBP | JPY | CAD | AUD | NZD | CHF | |
|---|---|---|---|---|---|---|---|---|
| USD | -0.12% | -0.11% | -0.15% | -0.06% | -0.24% | -0.21% | -0.05% | |
| EUR | 0.12% | -0.01% | -0.05% | 0.05% | -0.10% | -0.10% | 0.06% | |
| GBP | 0.11% | 0.01% | -0.02% | 0.06% | -0.12% | -0.06% | 0.10% | |
| JPY | 0.15% | 0.05% | 0.02% | 0.08% | -0.11% | 0.10% | 0.11% | |
| CAD | 0.06% | -0.05% | -0.06% | -0.08% | -0.15% | -0.14% | 0.04% | |
| AUD | 0.24% | 0.10% | 0.12% | 0.11% | 0.15% | 0.32% | 0.16% | |
| NZD | 0.21% | 0.10% | 0.06% | -0.10% | 0.14% | -0.32% | -0.09% | |
| CHF | 0.05% | -0.06% | -0.10% | -0.11% | -0.04% | -0.16% | 0.09% |
The heat map shows percentage changes of major currencies against each other. The base currency is picked from the left column, while the quote currency is picked from the top row. For example, if you pick the Euro from the left column and move along the horizontal line to the US Dollar, the percentage change displayed in the box will represent EUR (base)/USD (quote).


